Reporting and plotting
Reporting and plotting is compatible with marl-eval.
If experiment.create_json=True (this is the default in the experiment config)
a file named {experiment_name}.json will be created in the experiment output folder with the format of marl-eval.
You can load and merge these files using the utils in eval_results
to create beautiful plots of
your benchmarks. No more struggling with matplotlib and latex!
Example plots
Here are some example plots you can generate, for more info, check out marl-eval.
Aggregate scores
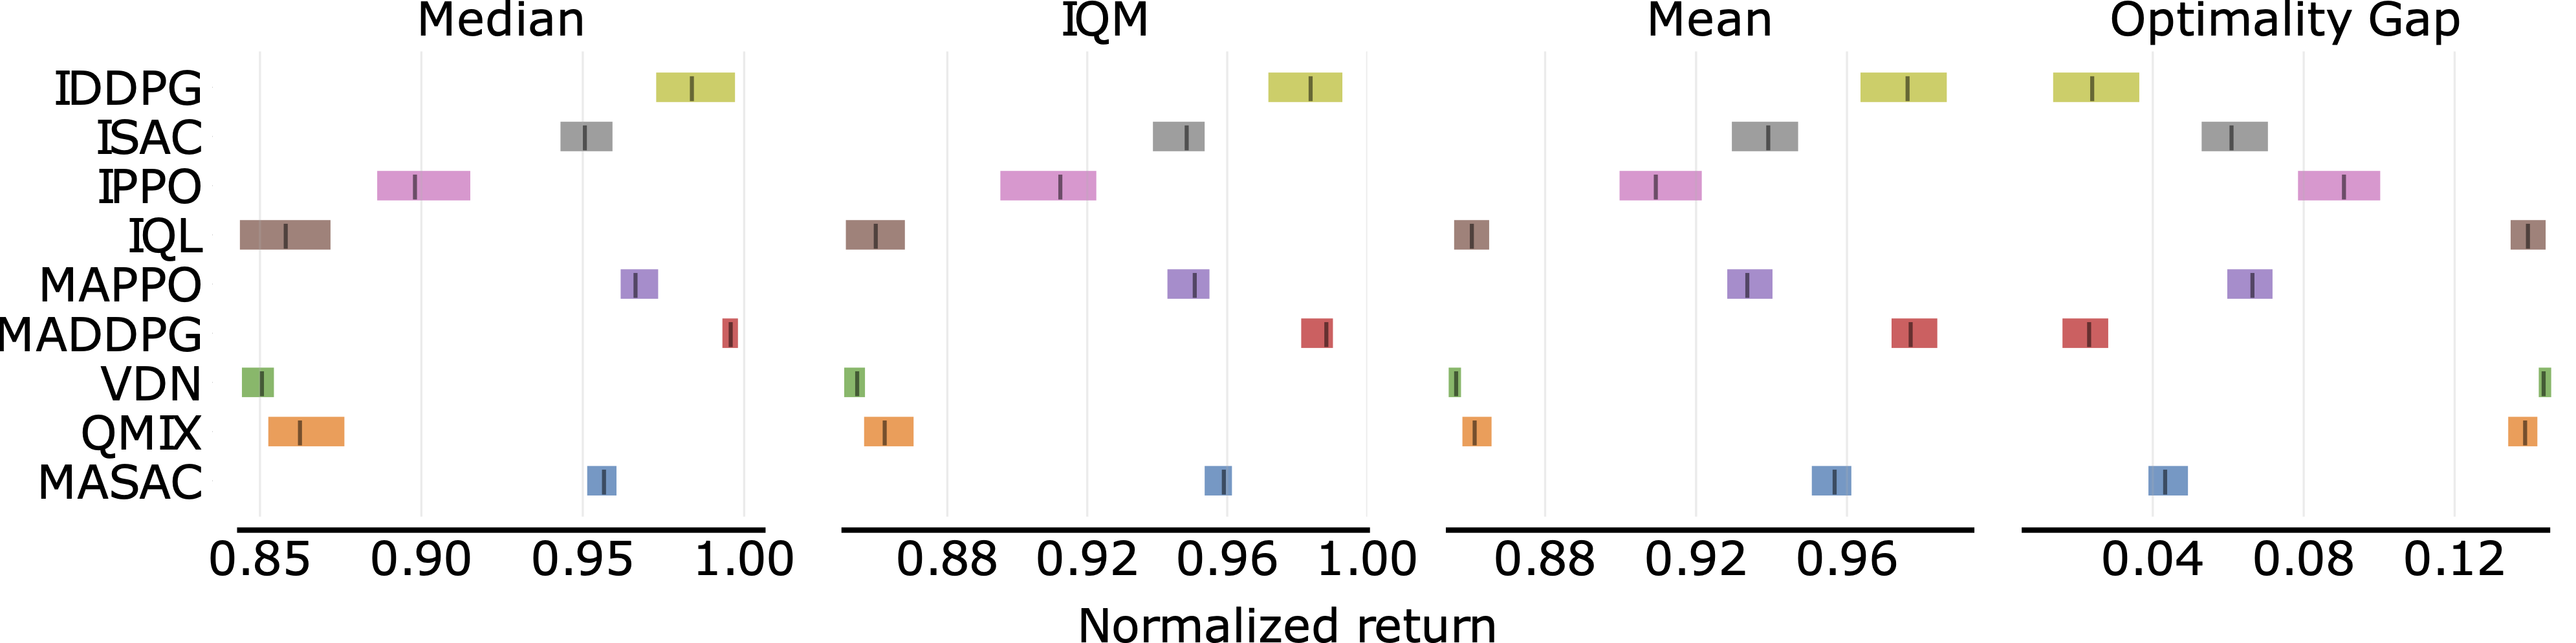
Aggregate scores
Sample efficiency curves
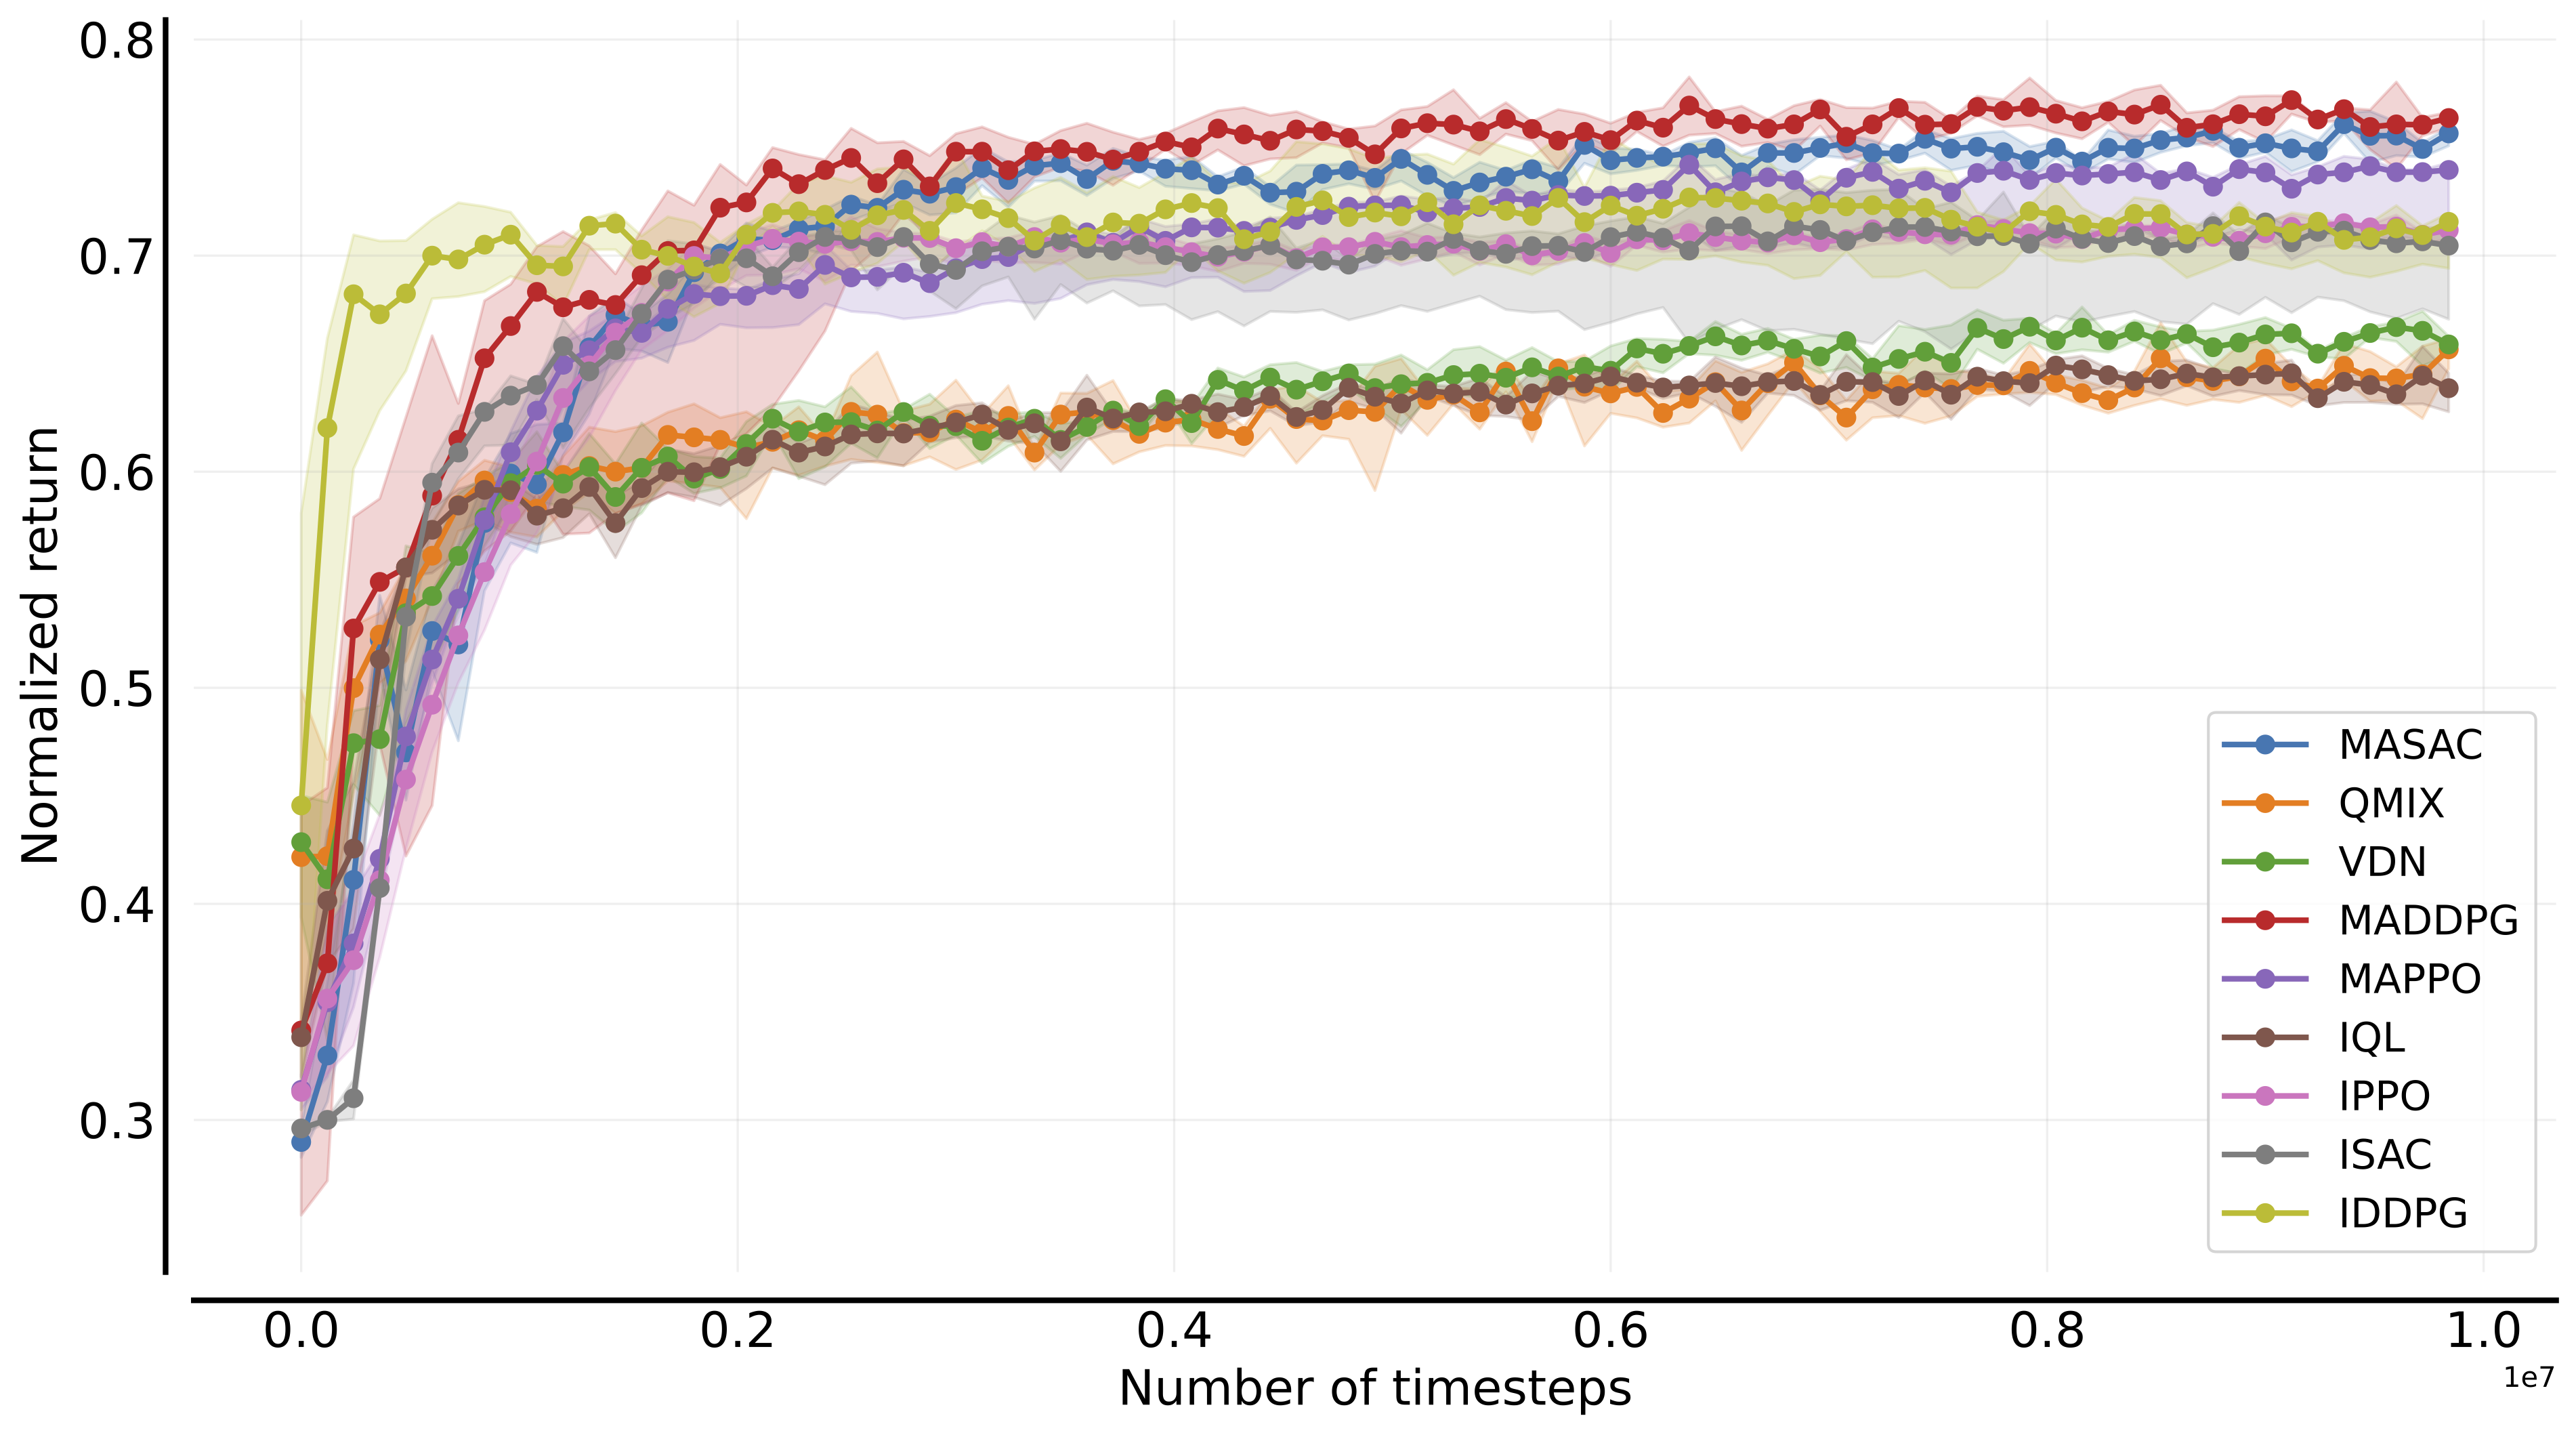
Sample efficiency curves
Performance profile
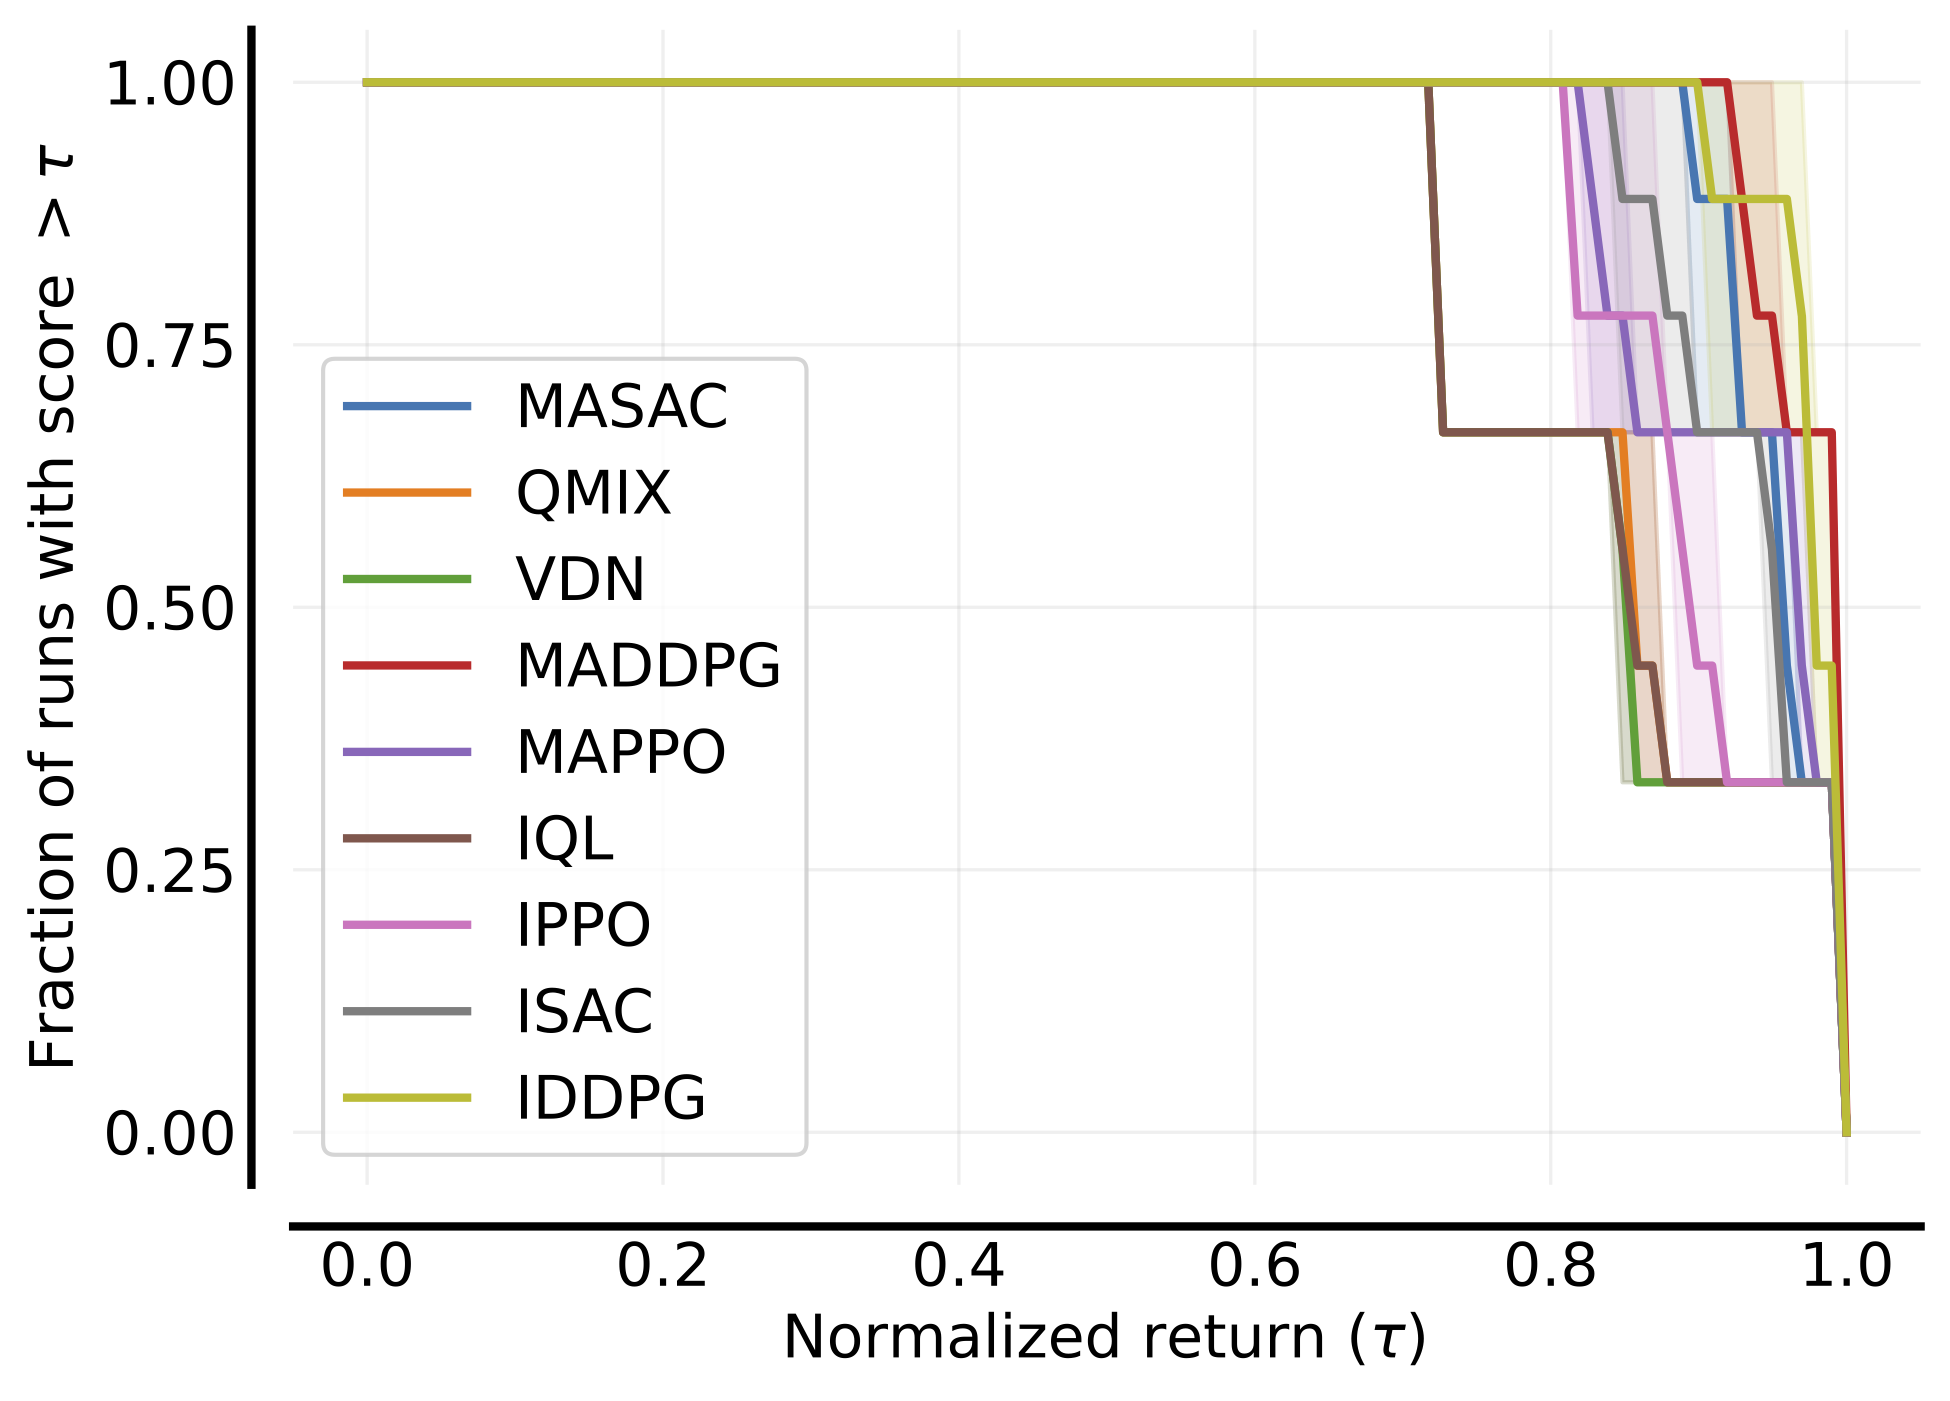
Performance profile